Bayer: Research and Interface Design for ICU ARDS Monitoring

My contribution · Bayer
ICU Angel / ARDS monitoring
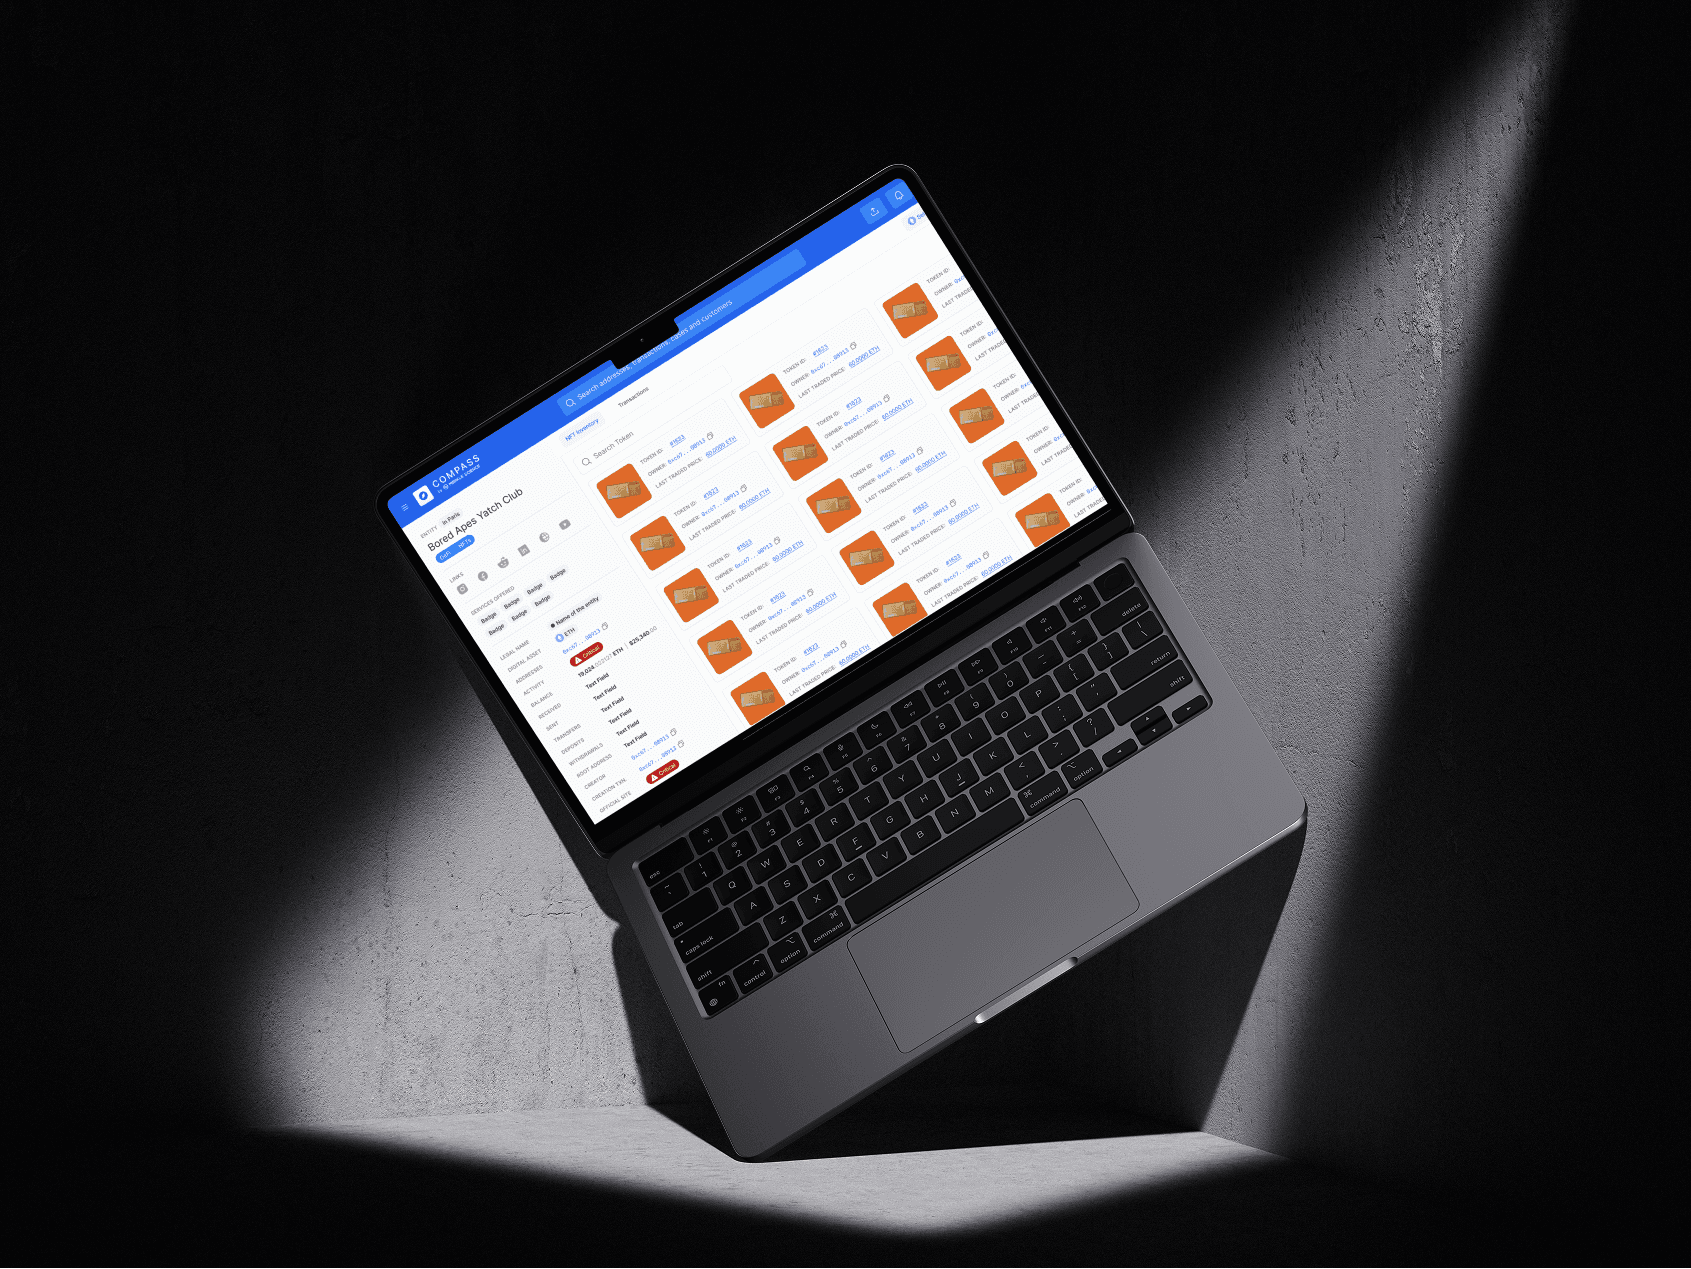
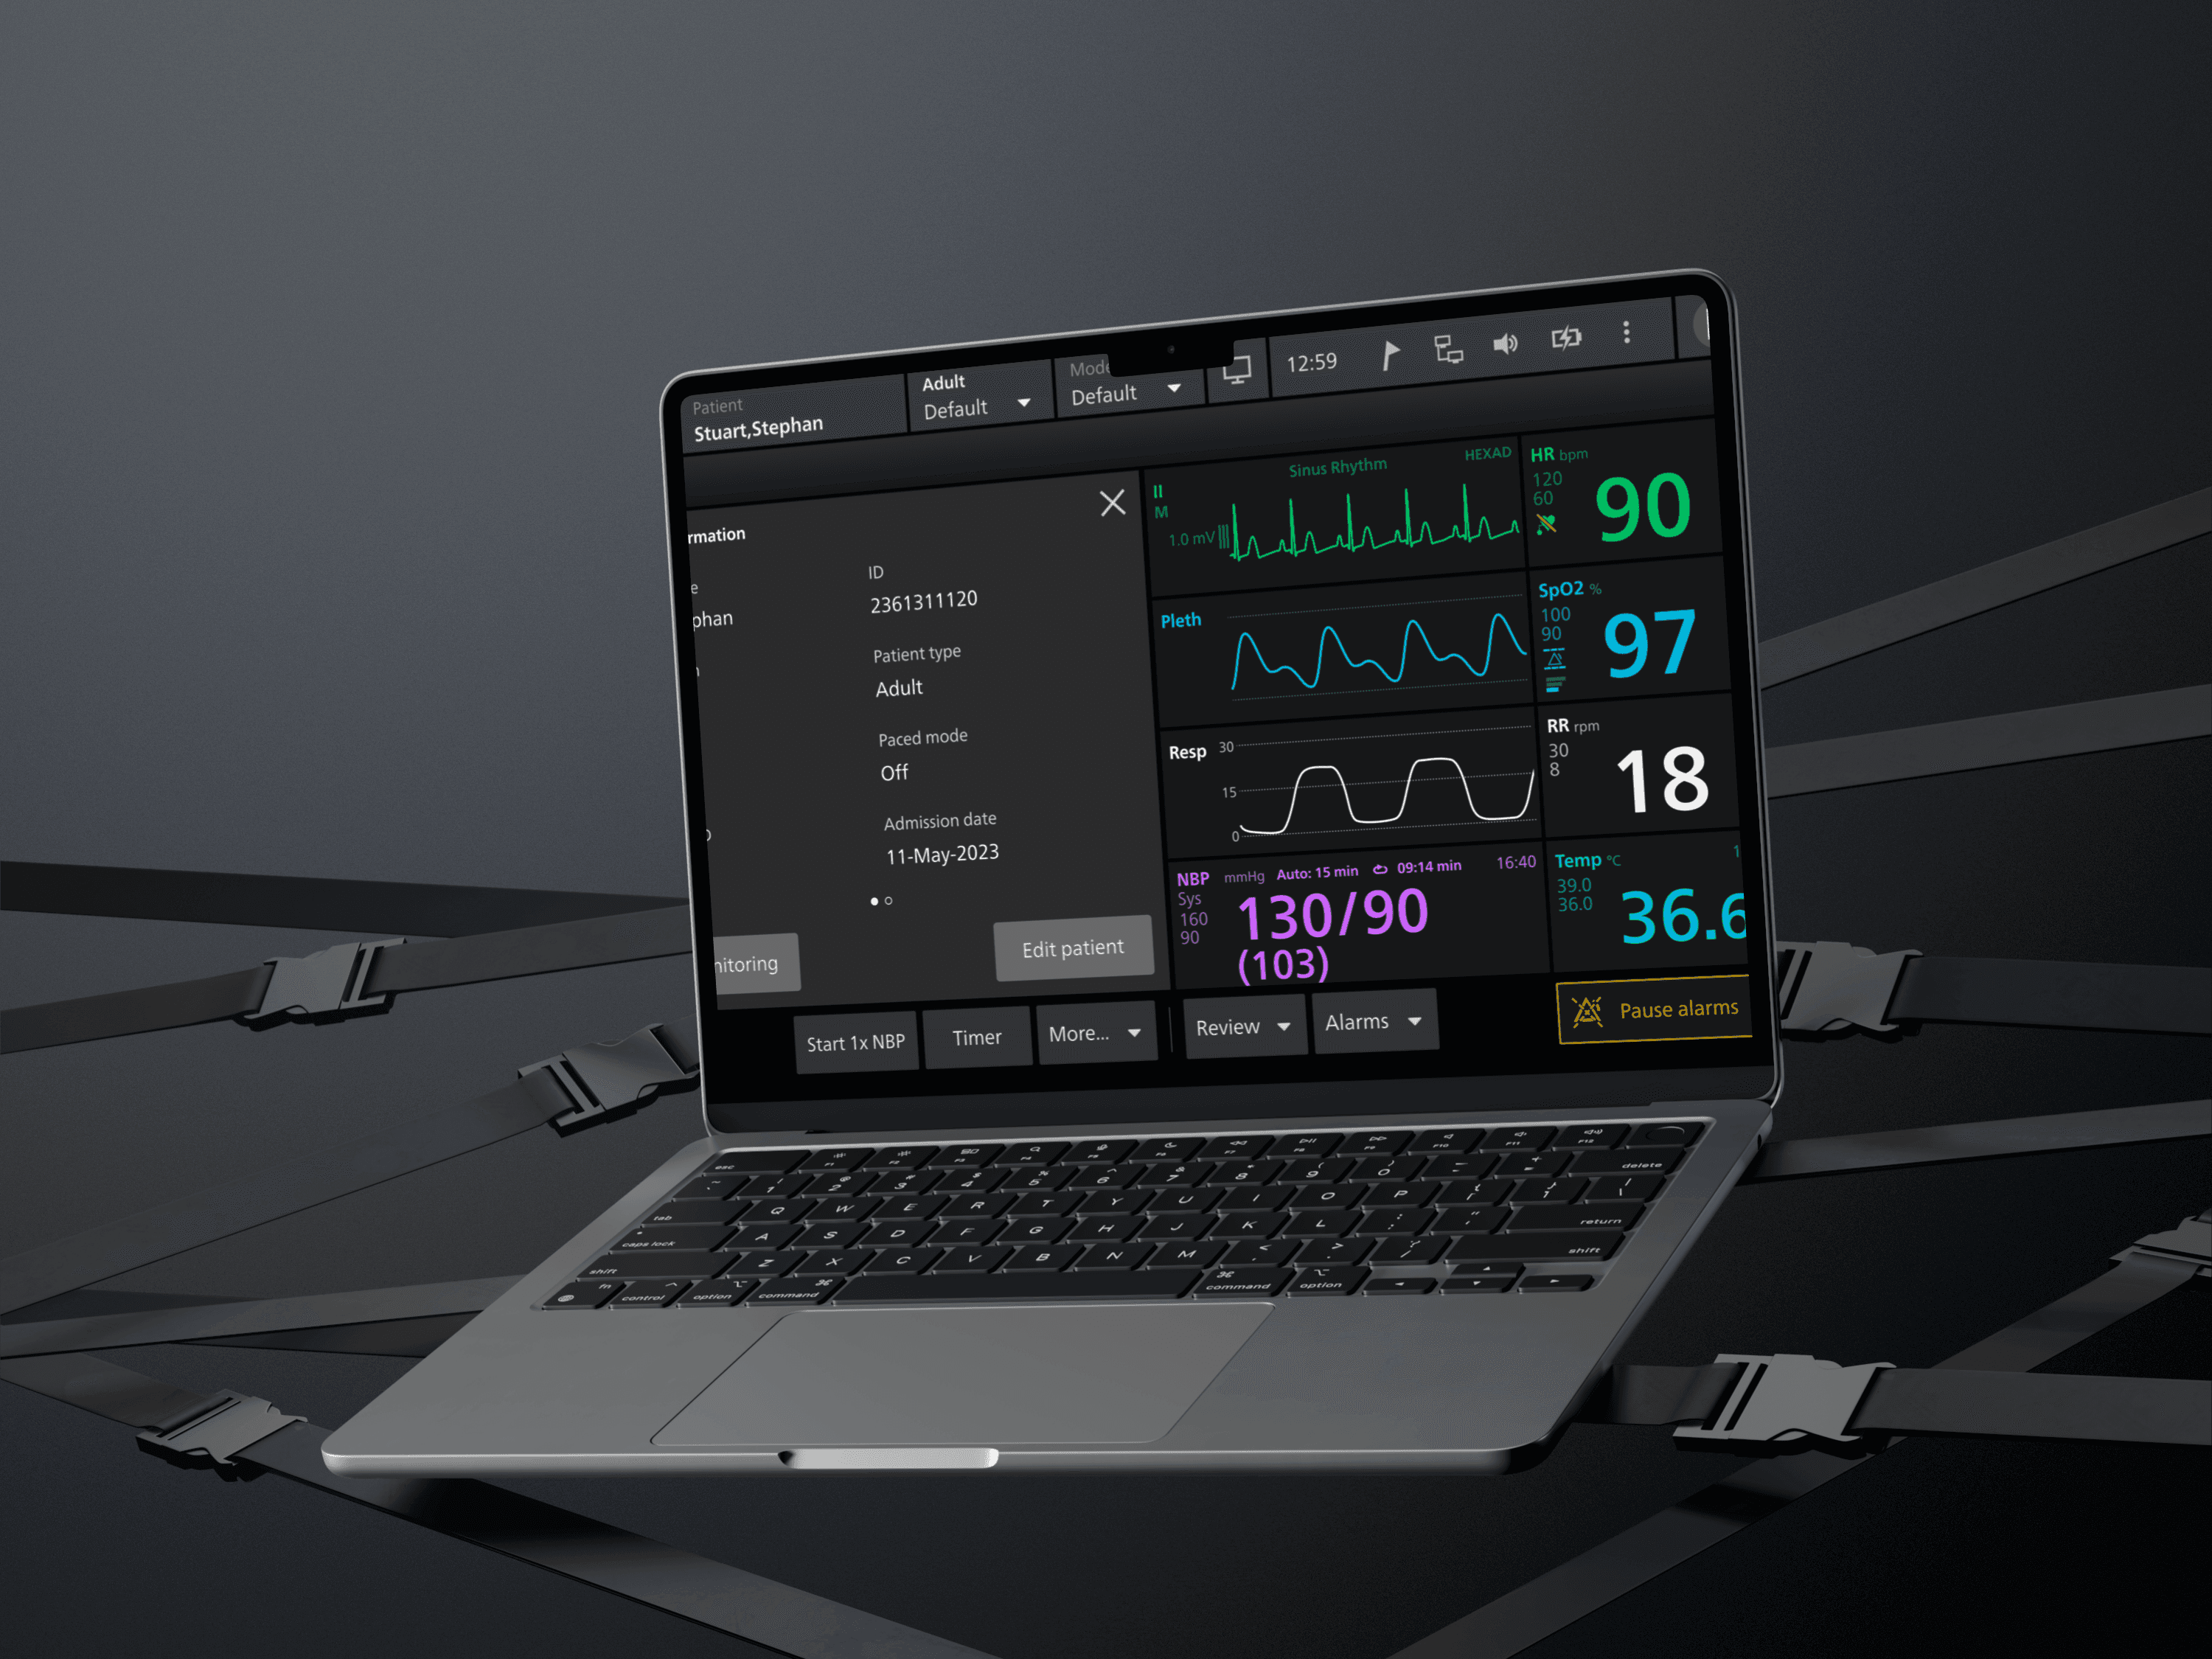
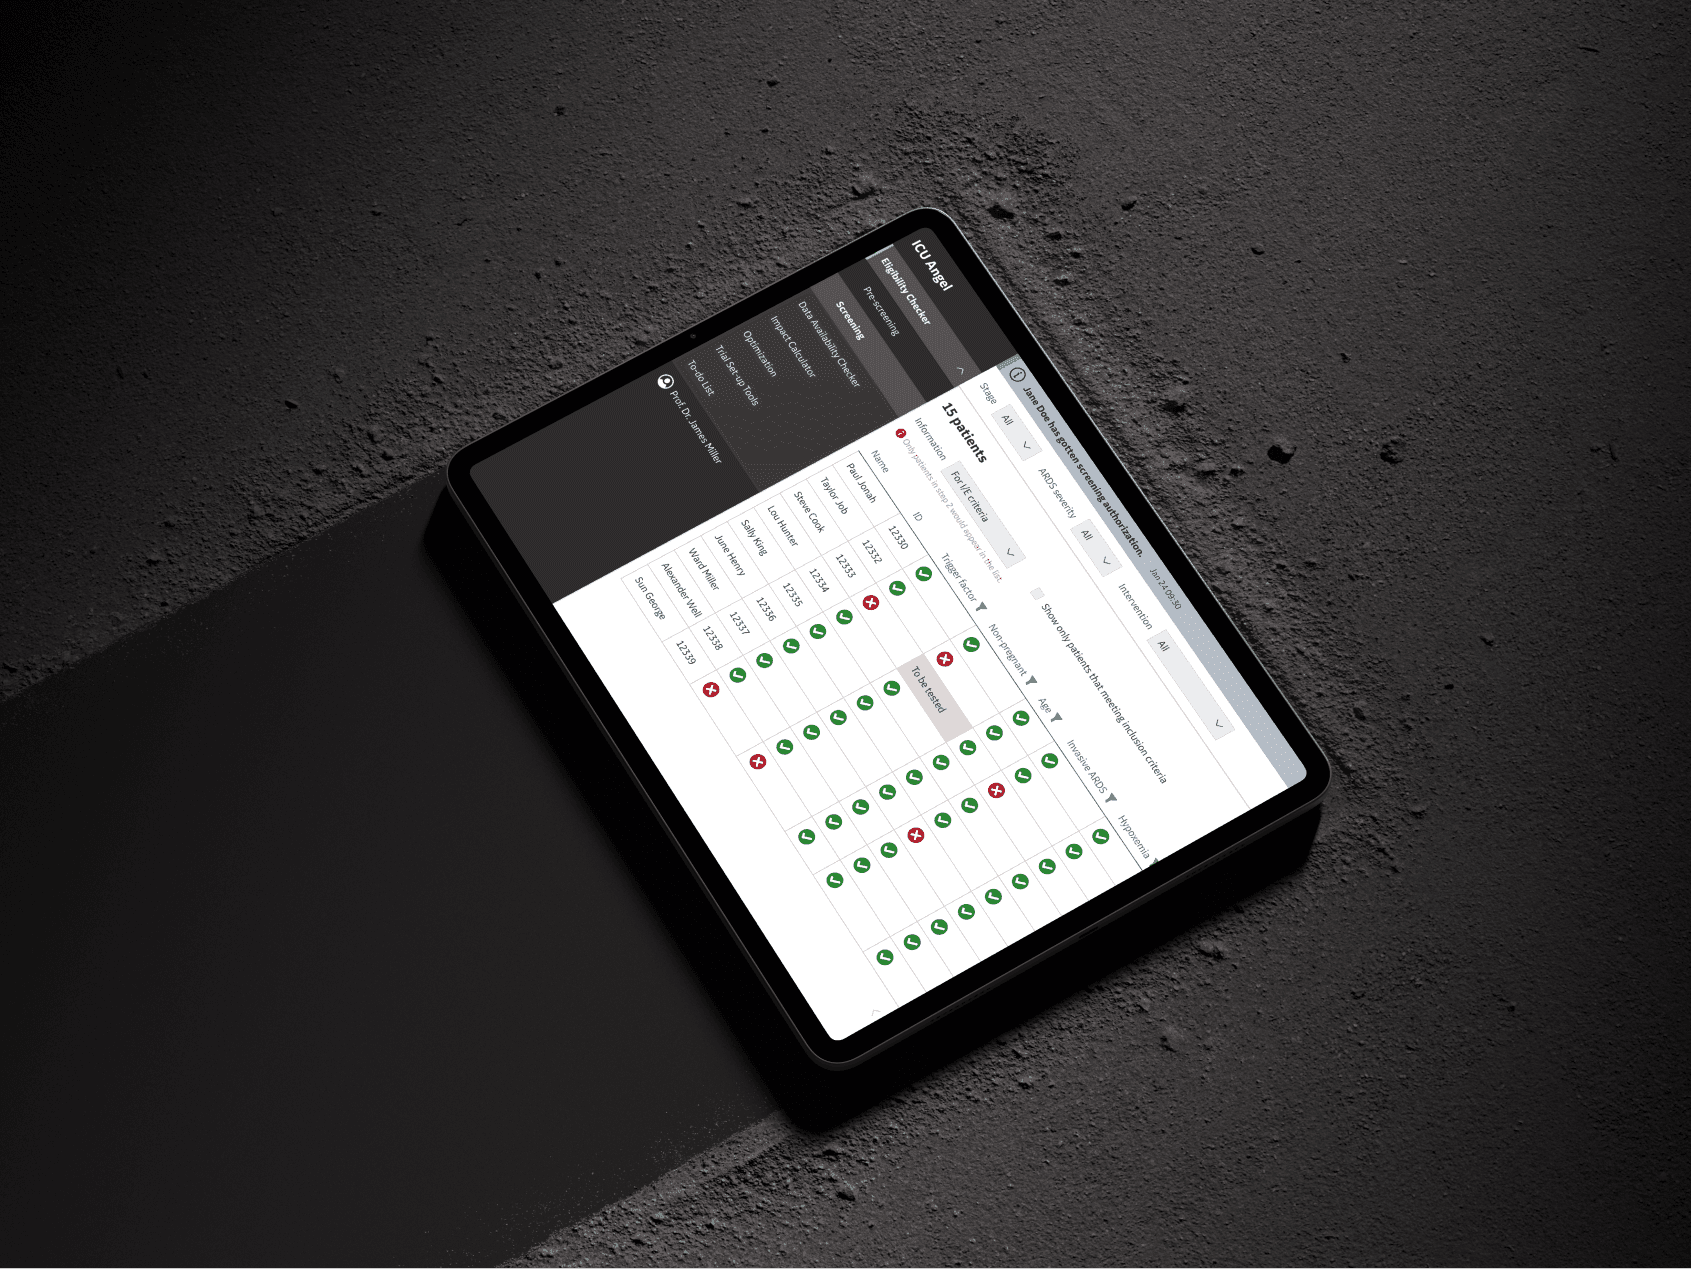
Designed ICU Angel workflows for clinicians and principal investigators reviewing ARDS progression, vital signs, medication response and research data.
What I owned
- Mapped how ICU clinicians reviewed disease progression, medication response and live monitoring data.
- Designed the clinician interface and aggregated views for investigators.
- Made changing status and escalation decisions easier to review on screen.


About The Project
Project Overview
- Role: Senior Product Designer at Bayer.
- Solution: ICU Angel combined an ARDS medication with a digital monitoring platform.
- Objective: Help clinical teams track patient vitals, ARDS progression and medication response in real time.
I designed the digital part of ICU Angel to work alongside a new ARDS medication. My work covered two needs:
Give doctors and nurses a clear view of disease progression and medication response.
Give principal investigators aggregated data for research and treatment-protocol reviews.
User Research & Insights
- Interviews: I spoke with ICU physicians and nurses about the problems they faced while managing ARDS.
- Observation: I observed ICU work, mapped the existing workflows and noted where information or time was lost.
- Surveys: A wider group of ICU staff answered questions about alarm fatigue, system usability and medication compliance.
- Wireframe testing: A pilot group tested the early flows against the clinical requirements and safety-critical tasks.
Workflow synthesis
I translated clinical requirements into reviewable ARDS-monitoring workflows that the clinical and product teams could inspect together.
I separated the clinician-facing bedside view from the investigator view so each team could focus on the decisions it needed to make.
I made changing disease stage, medication response and patient status easier to scan without losing the supporting context.
I used prototype reviews to test whether the information hierarchy supported the next clinical or research action.
Interaction and risk modelling
The interaction work focused on behaviour that could affect a clinical decision:
- ARDS stage: Each stage, including at risk and severe, had a distinct visual treatment for faster recognition.
- Alert priority: Urgent alerts appeared first so clinicians could separate them from lower-priority notifications.
- Medication tracking: A dedicated section showed administration times and doses.
Prototyping & User Feedback Loop
We built interactive prototypes for admission, medication scheduling and real-time vital-sign monitoring.
- Structured testing: ICU staff and principal investigators worked through the prototypes in moderated sessions.
- What we heard: Doctors wanted adjustable alert thresholds. Nurses asked for shorter data-entry forms. IT staff needed clear security controls for clinical data.
Context & Problem Statement
ARDS is a life-threatening condition that requires timely, informed decisions in intensive care. The teams we studied did not have one real-time view connecting patient monitoring with the ARDS medication workflow.
Key Challenges
- Fragmented monitoring: Clinicians had no single view of vital signs, disease stage and medication response.
- Data spread across systems: Nurses and doctors checked several systems to understand a change in patient status.
- Research data: Principal investigators had to combine separate sources before they could analyse treatment outcomes across patient groups.
Stakeholder Analysis: Who We’re Designing For
Doctors
- Need: A reliable view of ARDS progression that supports treatment decisions.
- Problem: Important changes could be buried in a large volume of patient data.
Nurses
- Need: An interface that fits daily ICU work without adding unnecessary steps.
- Problem: Alarm fatigue and slow data entry took time away from patient care.
Principal Investigators
- Need: A shared dataset for comparing medication response across ARDS stages and patient groups.
- Problem: Separate data sources made larger clinical analyses slower and more prone to error.
Impact Metrics & Outcomes
The evaluation focused on the following outcomes:
Faster review of critical changes
- Validation focus: Whether clinicians could recognise a critical change and decide what to review next without searching across separate views.
- Finding: Real-time visual cues helped teams decide which changes needed attention first.
Less switching between systems
- Workflow focus: Bring disease progression, vital signs, medication response and alerts into one clinical view.
- Finding: The combined dashboard reduced the need to switch between separate monitoring views.
Patient-outcome boundary
This portfolio documents the research and interface work. It does not claim that the design caused a measured change in patient outcomes.
The design intent was to make warning signs and supporting data visible sooner, so clinicians could decide what to investigate next.


Need this level of detail in your product?
Bring the hard product decision into the room early.
For a product team, that can mean a focused design, system or prototype project. For a hiring team, it is a closer look at how I work across research, interfaces and code.